
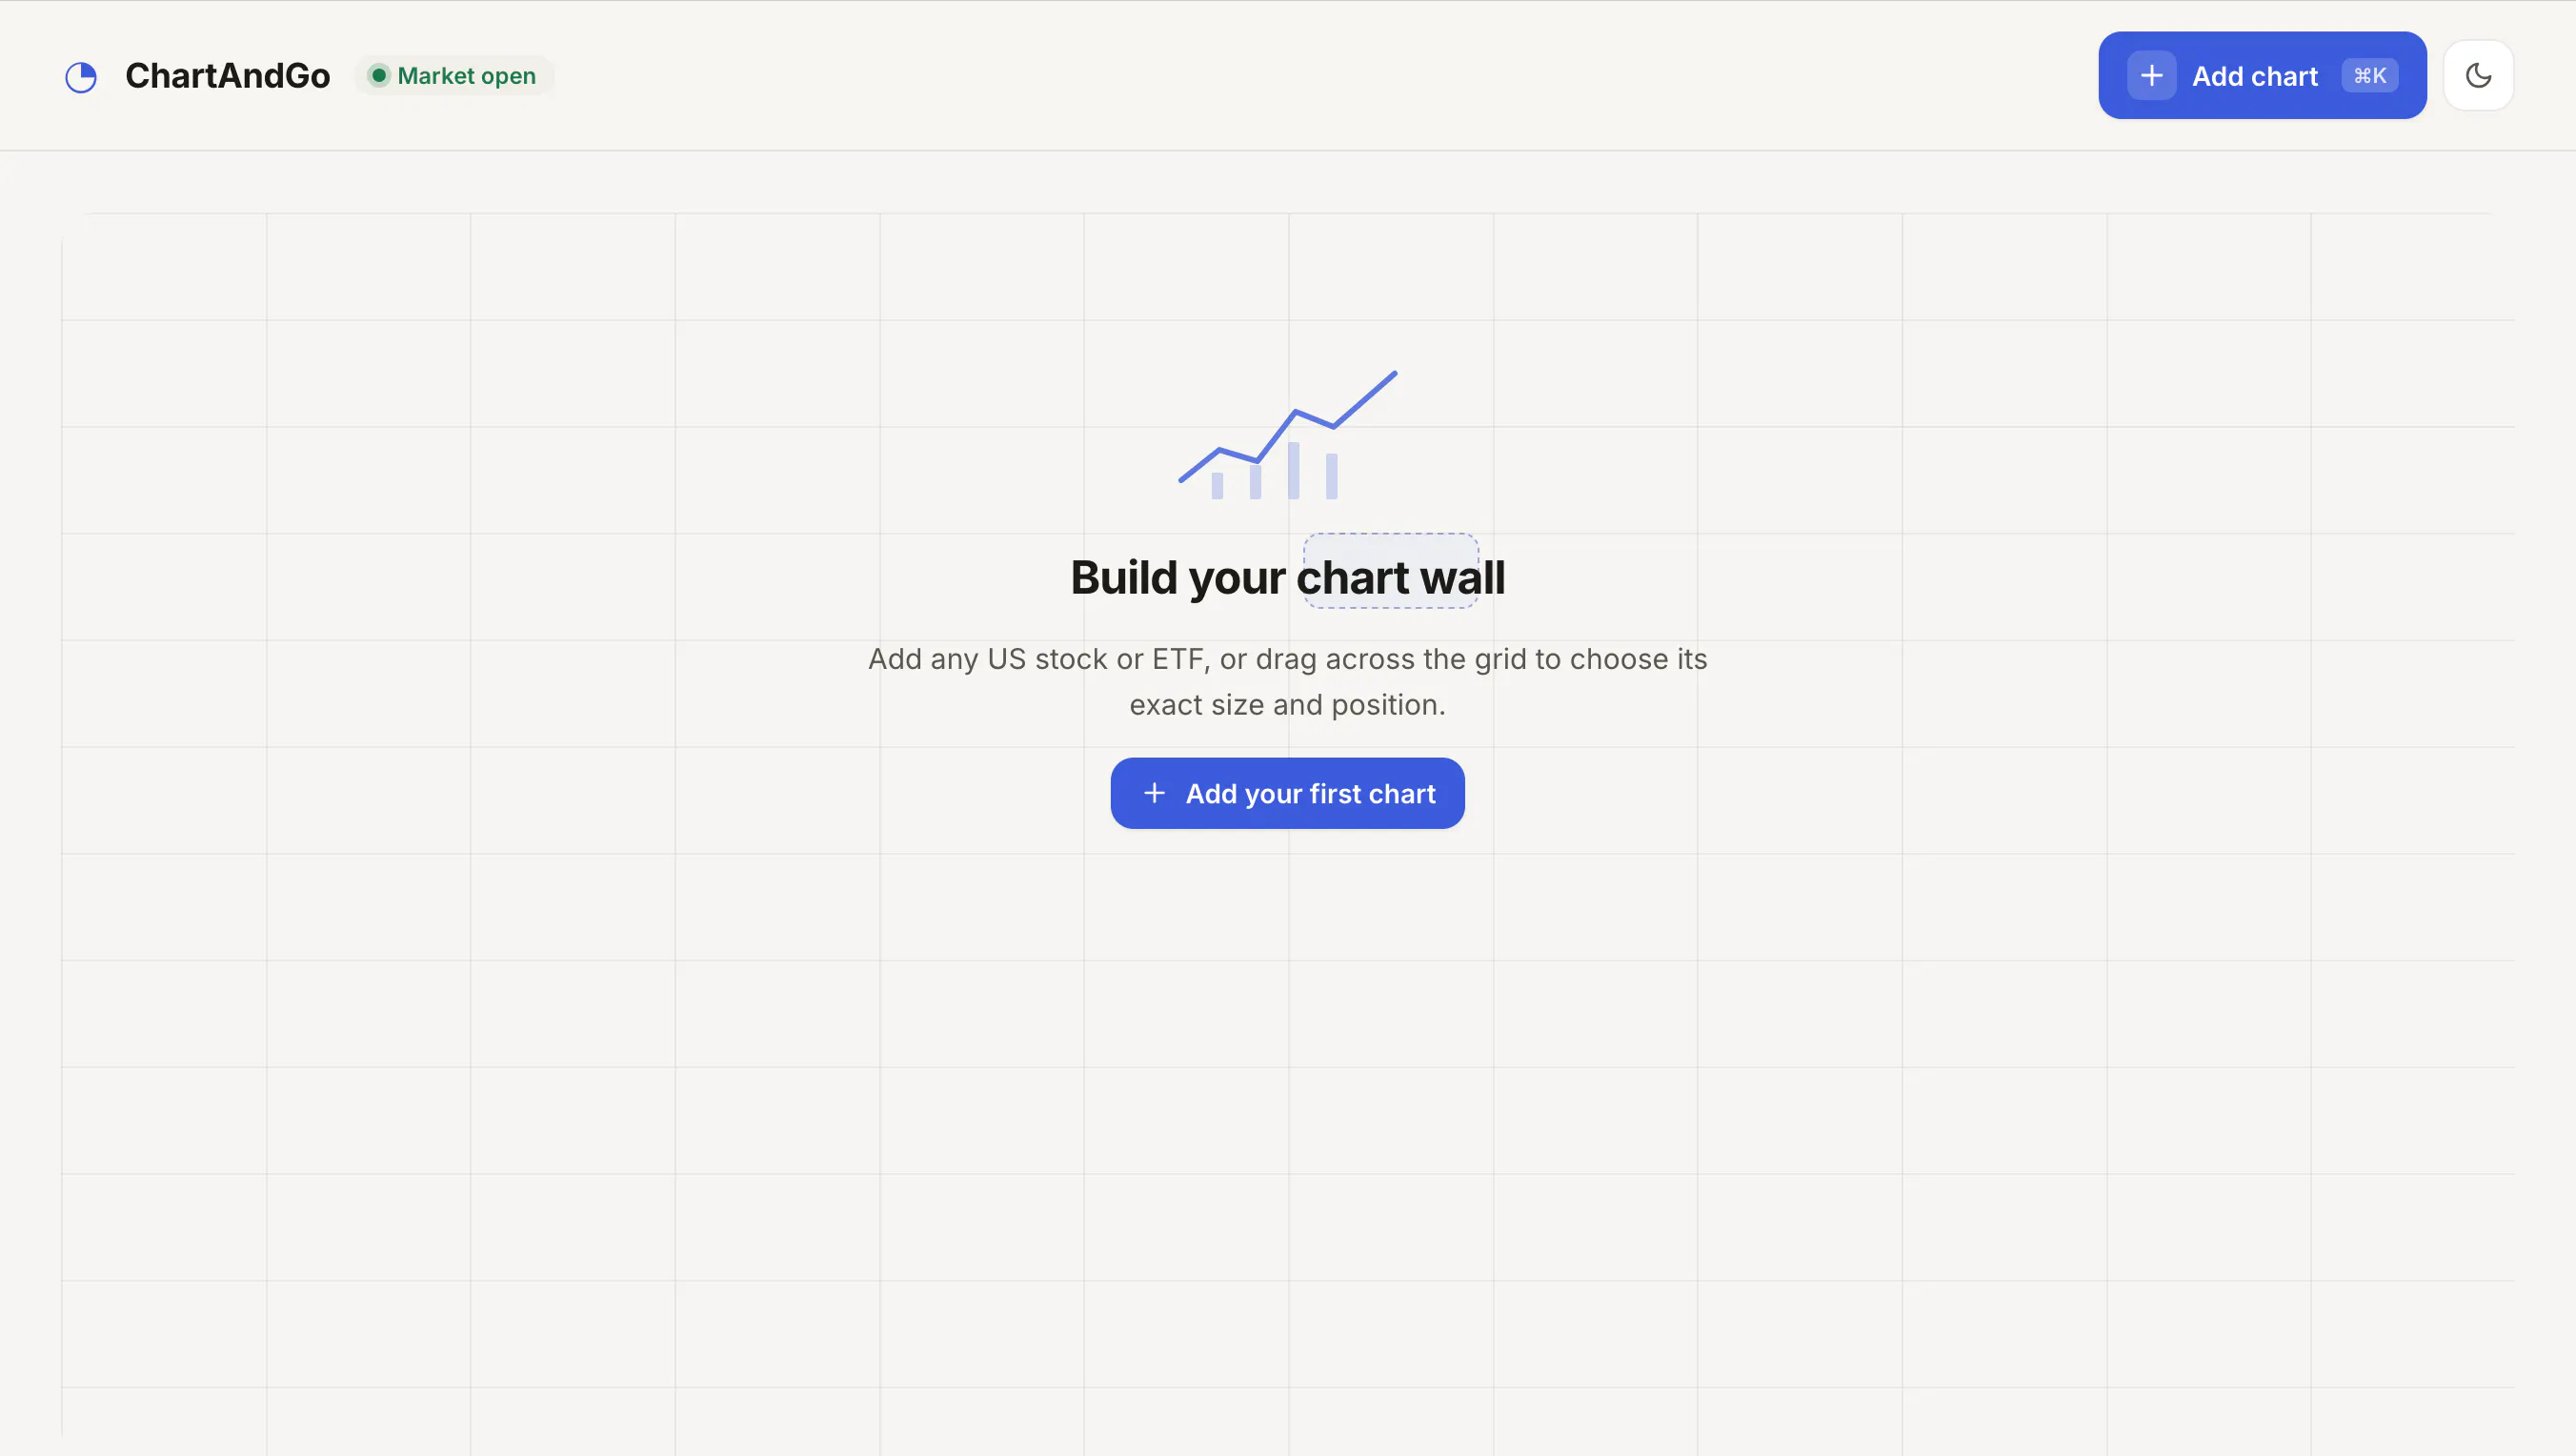
ChartAndGo is a fast, flexible workspace designed specifically for comparing US stocks and ETFs. Built for investors and fintech enthusiasts, this data visualization tool allows users to build their perfect multi-chart stock workspace with complete ease.
With ChartAndGo, you can add independent charts and seamlessly drag, resize, and arrange them into your ideal layout. Whether you want to compare different symbols side by side or evaluate multiple timeframes, the platform supports multiple visualization formats including candlestick, line, area, and OHLC views.
ChartAndGo is a fast, flexible workspace tool designed for comparing US stocks and ETFs using customizable, independent charts.
ChartAndGo supports candlestick, line, area, and OHLC views for your financial comparisons.
Yes, you can add independent charts and drag, resize, and arrange them to build your ideal layout.
0 community reviews for ChartAndGo
Help the community by sharing your experience. Your review helps others make better decisions.

I build products that connect people.